- CDY 5%+
- 🙂 25Y streak (almost no-drop) .. https://www.macrotrends.net/stocks/charts/NWBI/northwest-bancshares/dividend-yield-history
- 25Y price chart (above) shows growth.
- 🙂 low quantum
- analysts neutral .. tgt $14 https://money.cnn.com/quote/forecast/forecast.html?symb=nwbi
- $2B- small cap, long history as a regional bank, not a growth stock
Tag: t_aristocrat
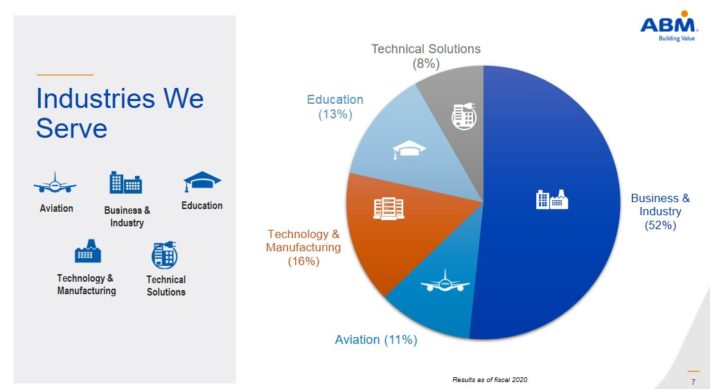
55>ABM 2% facility service #
- 🙁 5Y? no growth
- 🙂 CDY 1.8%.. 53Y dividend-king, according to https://www.suredividend.com/dividend-kings/
- .. verified on https://www.macrotrends.net/stocks/charts/ABM/abm-industries/dividend-yield-history
- analyst OK $55 https://money.cnn.com/quote/forecast/forecast.html?symb=abm
- mid-cap
Shares also look significantly undervalued, with a fiscal 2021 price-to-earnings ratio of 12.2, which is well below our fair value estimate of 17.5. ABM Industries is a leading provider of facility solutions, which includes janitorial, electrical & lighting, energy solutions, facilities engineering, HVAC & mechanical, landscape & turf, and parking.
div: mufu^stock^Reit^ETF #DPR #NAV-erosion
A mutual fund eats away up to 2% of the dividend yield, in the form of expense ratio. ETF is around 0.5%.
I have never earned real dividend yield above 10% so I am keen to experience it. The Allinz funds are so fake and manipulative .. /marketing-gimmicks/.
==== DPR (Dividend Payout Ratio) .. is the basis of dividend safety , sustainability and dependability, the differentiator between stocks (below 60%), ETFs (100%) and mufu (often above 100%)
REITs are required to pay out at least 90% of their net earnings, paid out as dividends. A payout of 70–80% of FFO is the U.S. industry average, regardless of taxable income.
ETFs receive stock dividends and are required to pay them out either in cash or as additional shares to shareholders.
Good dividend stocks have payout ratio below 60%, otherwise flagged as a dividend-safety red flag. I don’t think mufu has these two concepts. High-dividend mufu often need to liquidate (and reduce) NAV to sustain high target dividend. Examples include 1) AllianzHY 2) OCBC Templeton monthly div (I see this fact every month in my OCBC statement!) 3) AGD below. The frequent liquidation requires active management, and might increased expense ratio.
In an unprofitable year, a blue-chip can reach into its deep pockets of cash reserve and decide whether to keep up dividend. The dividend_aristocrats have done exactly that in every down turn. Most mufu funds have no such reserve as far as I know. Therefore, I would not want to depend on a mufu to keep up dividend payout… not dependable.
- — dividend stability:
- a good blue-chip including some REITs can maintain dividend amount for decades, based on a healthy payout ratio on the back of robust cash flow
- an ETF is a simple construct and unable to achieve it if any constituent stock ever cuts dividend.
- mufu is a complex structure. Whenever a mufu shows stable high dividend, it’s invariably “cheating” with DPR > 100% , by eroding NAV.
— The Aberdeen AGD case study … https://secure.fundsupermart.com/fsm/article/view/rcms222722/invest-in-this-income-strategy-with-regular-paying-dividends-and-potential-capital-gains is another case study. The FSM article claims “As seen in Chart 3, the strategy has also been able to deliver rather consistent dividend yields over the past few years, which at most times hover above 6%.” It sounds like the constituent stocks were generating 6% dividend consistently !?
Highly suspicious when you look at the top holdings — all low CDY and not known for high-yield. So I suspect the 6% dividend payout of this fund is financed by NAV erosion [liquidating its assets, hitting a payout ratio above 100%]. Fund managers do such things really to attract AUM. If the manager doesn’t liquidate assets, then the fund NAV would have climbed faster.
So this fund is probably a growth fund masquerading as a slow-growth income fund.
SJI 5% #util
- 🙂 CDY 5%
- 🙂 33 Y streak .. https://www.macrotrends.net/stocks/charts/SJI/south-jersey-industries/dividend-yield-history
- 30Y trend good, but 5Y decline
- analysts neutral. tgt $25 https://www.tipranks.com/stocks/sji/forecast
- $3B mid-cap
$125>ABT 2%- Abbott #add$50..100
- 🙁 https://www.morningstar.com/articles/1076129/12-overvalued-mega-cap-stocks-to-avoid
- 🙂 CDY 1%+.. 50Y dividend-king, according to https://www.suredividend.com/dividend-kings-nfg/
- .. verified on https://www.macrotrends.net/stocks/charts/ABT/abbott-laboratories/dividend-yield-history
- 🙂 40Y up https://www.macrotrends.net/stocks/charts/ABT/abbott-laboratories/dividend-yield-history
- 🙂 long-term growth + cash-cow
- analyst mostly positive late May $140 https://www.tipranks.com/stocks/abt/forecast
- $200B mega cap
65>NFG 3% gas #wanted $100; invested $80
- 🙂 CDY 3% (was 4% when trading lower).. 50Y dividend-king, according to https://www.suredividend.com/dividend-kings-nfg/
- .. verified on https://www.macrotrends.net/stocks/charts/NFG/national-fuel-gas/dividend-yield-history
- analyst OK $65 https://money.cnn.com/quote/forecast/forecast.html?symb=nfg
- 5Y? no trend, but 3Y up, 10Y up
- $5B midcap
https://www.suredividend.com/dividend-kings-nfg/ has lots of details.
IBM 5%
K 3.5%+ #Kellogg
- 🙂 CDY 3.7% https://www.macrotrends.net/stocks/charts/K/kellogg/dividend-yield-history
- https://finance.yahoo.com/news/11-best-dividend-aristocrats-over-142310204.html .. listed as aristocrat
- 🙁 analyst neutral. tgt xxx https://money.cnn.com/quote/forecast/forecast.html?symb=k
- 🙁 fractional required
3M 4% #$5..10
- https://www.fool.com/investing/2022/06/11/3ms-4-dividend-yield-isnt-a-reason-to-buy-the-stoc/
- 🙁 analyst negative. (Jun22) tgt 160 https://money.cnn.com/quote/forecast/forecast.html?symb=mmm
- 🙂 CDY 3% https://www.macrotrends.net/stocks/charts/MMM/3m/dividend-yield-history
- .. https://www.suredividend.com/dividend-kings/ .. listed as a divKing with 64Y of div growth
- 🙁 5Y down
- 🙂 DJ30 blue chip
GIS 3% #GeneralMill
- 🙂 CDY 3% https://www.macrotrends.net/stocks/charts/GIS/general-mills/dividend-yield-history
- https://finance.yahoo.com/news/11-best-dividend-aristocrats-over-142310204.html .. listed as aristocrat
- 🙁 analyst neutral. tgt xxx https://money.cnn.com/quote/forecast/forecast.html?symb=gis
- 🙁 fractional required